ELK_Python_Client
ELK_Python_Client
目標
利用原本蒐集Log的ELK來進行系統告警
graph LR;
    A[ES DB] --Search Index-->B[ELK Client];
    B -- 分析風險 -->C[主機];
    C -- Excute PowerShell --> D[IIS]
資訊
Kibana也有自己的Alert系統,可利用此方式避免自己二次開發
改成 Kibana_Alert設定 方式設定並透過 Sever Log的方式記錄在kibana.log,再透過Python Custuomer模式取得Kafka資料
sequenceDiagram
	autonumber
    participant Kibana
    participant ElasticSearch
    participant Logstash
    participant Kafka
    participant Python
    participant Enginner
    loop AttackCheck
	    Kibana ->> ElasticSearch : 搜尋告警條件
	    ElasticSearch -->> Kibana : Return Result
        Kibana ->> Kibana : ReWrite kibana.log
        Logstash ->> Kibana : Monitor kibana.log
        Logstash ->> Kafka : Append Alert Messsage
        Python ->> Kafka : 【Monitor-Application-Alert】
        Python ->> Enginner : Line Notify Message
    end
- 透過Kibana_Alert設定加入要搜尋的條件異常Request統計
- 透過搜尋條件ElasticSearch回傳結果
- 根據回傳結果寫入 Server Log,Kibana設定寫入 /opt/module/kibana/log/kibana.log
- 安裝Logstash 來監測 /opt/module/kibana/log/kibana.log 是否有異動
- 有異動就把資料寫入 kafka的Topic: Monitor-Application-Alert
- 開發 Python 使用kafka套件來監測 kafka的 Topic: Monitor-Application_Alert
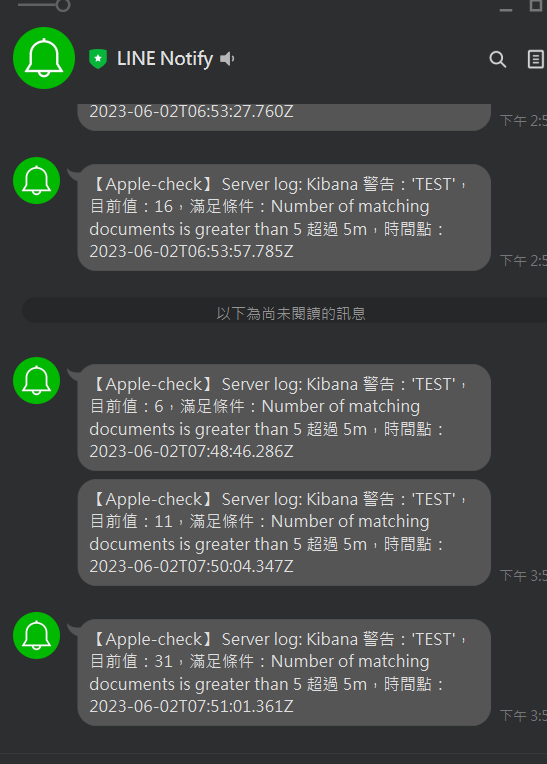
- Python 監測到 發送 Line Notify Message 給管理者
程式碼
Apache Kafka and Python - Getting Started Tutorial (confluent.io)
pip install confluent-kafka
異常Request,針對Page統計
- 偵測Request Page異常:
- p
*.php、admin的來源IP進行封鎖:page=*.php,欄位:IP、page、Date by day - admin Reqeust 有問題的路徑(敏感路徑要列出來)
- p
- 偵測Web異常流量
- 整需要先了解平均Request數量/五分鐘:計算每小時平均Request數
- Group by IP。 Top 10 出來 確認是否可看出蛛絲馬跡
疑似攻擊 Query-Get、Param-Post
- 判斷SQLINJ、XSS攻擊:Query = Select 、 1 = 1 、...等等